Stacked Cohort Activity Chart
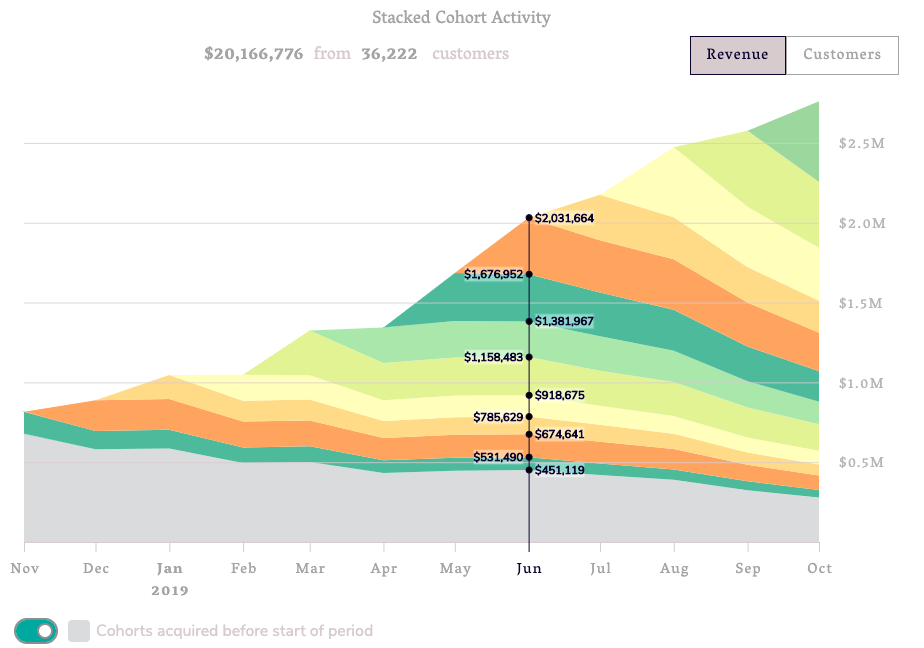
Everhort's stacked activity chart shows how much each monthly customer cohort contributes over time to a given metric, such as revenue or number of returning customers.The oldest cohort acquired in the selected time range will be the first colored band on the bottom, and then each subsequent monthly cohort is stacked on top one by one. This lets you view the impact each cohort is having on the overall metric at any point in time.
Here is an example chart where we have selected gross revenue as the metric using the toggle in the upper right. We have rolled our mouse over the month of June, 2019 to show the layer by layer details for that month:
Cohorts Acquired Before Period
By default, all cohorts that were acquired prior to the chosen time range will be rolled up and shown in a single gray band at the bottom, so that you can get an accurate view of the overall totals for each month. This also lets you compare the contributions of each cohort in the current time range to the performance of longer-tenured customers.
You can toggle this setting on or off using the slider switch in the area directly under the chart: 
If you want to break the gray band down into individual cohorts, just choose an earlier start date from the time range selector at the top of the page.
Isolate A Cohort
You can click on a cohort band to see how that cohort has performed individually over time:

Table View
As with all reports in Everhort, the data is also presented in tabular format and available for download as a CSV file.
